

Redesigning Quality Dashboard
At Meesho during problem discovery sessions a common problem had surfaced regarding degrading quality of products on Meesho. Due to ineffective supply-shaping of quality, suppliers aren’t able to make the right tweaks in their product specifications, listings or pricing so as to improve customers’ Product Quality experience and thereby improving business on Meesho.

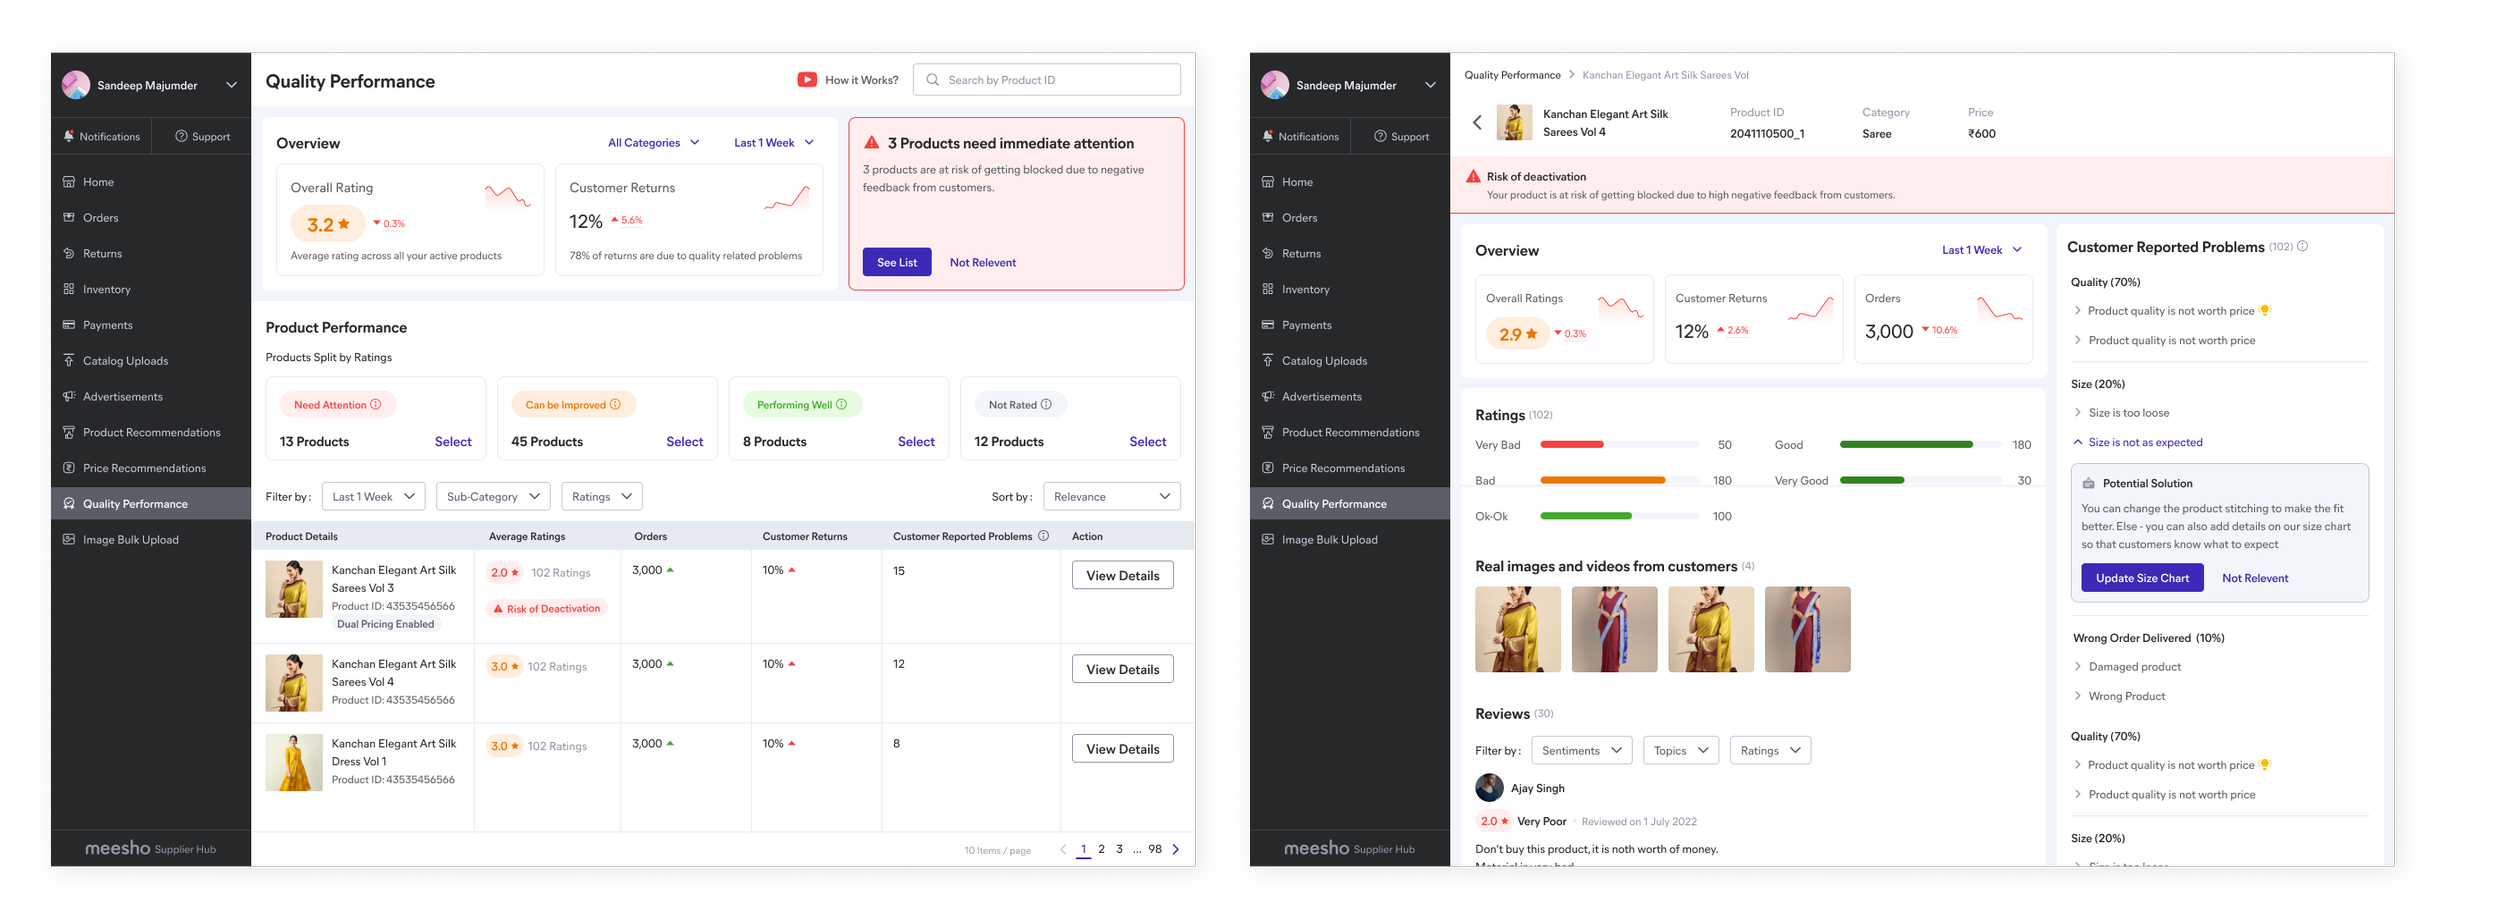
Image - Revamped New Quality Dashboard
Background
This project is a collaborative effort of the Quality team in Meesho. With alignment from the Supplier Growth team that is building an overarching growth insights dashboard, considering different stages of both projects, objectives and supplier mental models, we propose to solve existing Quality issues on the platform, in accordance with growth insights dashboard. The Quality dashboard would enable suppliers to understand how customer perceive quality of their products on Meesho and take necessary actions to improve them. We are looking at creating an impact by reducing 6 -6.5% on Bad Quality incidents. We aim to improve quality detraction score by 1 - 3 points and achieve a 5% quality returns benefit by revamping the existing Quality Dashboard on Meesho Supply Panel.
Problem Space
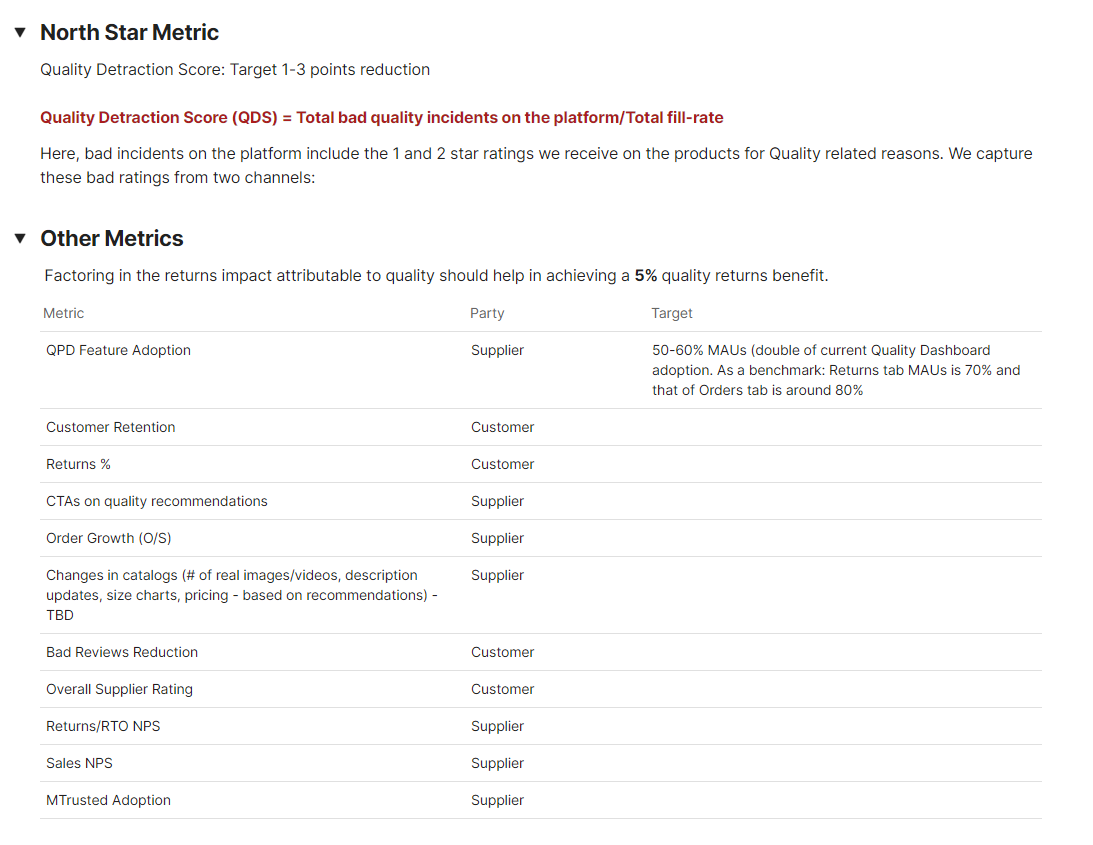
The first problem is to explain to suppliers, a new quality metric introduced by product team called QDS or Quality Detraction Score.
QDS is defined as the percentage of customers that are providing negative feedback on platform due to Quality out of total number of feedback provided on platform.
Quality Detraction Score (QDS) = Total bad quality incidents on the platform / Total fill-rate
What is QDS ?
Information is distributed across Quality Dashboard, Meesho mobile app and Returns tab which act as a roadblock for supplier comprehension
Suppliers are not able to analyze return reasons, return percentage, ratings and reviews together
Suppliers find it difficult to keep track ratings, reviews and improvement of their products over time
Non uniformity of information as the quality-related information is in parts at a supplier-level and in parts at a catalog level
Issues with Current Quality Dashboard
Video - Existing Quality Dashboard
Suppliers find difficulty in comprehending what’s wrong with the products quality / performance on Meesho
Suppliers want to benchmark the product quality with other competitors and track customer feedback
Suppliers want to see impact of quality improvement on their growth and overall business
As of the existing scenario M-trusted badge does not add value to the suppliers
Learnings from supplier calls
Image - Supplier calling to understand painpoints on Quality
Depending on intent and expertise of various cohorts of suppliers I mapped out which would be the most high priority and high intent jobs to be done for the suppliers on the dashboard .
Understanding Intent and Expertise of Suppliers

Insights to work upon
Framework to emphasize on quality on Meesho
Educating Suppliers about their product quality
Providing suppliers with reliable recommendations
So here are the design challenges
How might we create a framework to make suppliers be more critical and emphasized about quality of their products ?
How might we educate suppliers about their quality which is based on ratings , returns and reviews of their products ?
How might we provide reliable recommendation to suppliers to take actions and track their implications ?
Iterate fast , fail fast !
I moved ahead with an iterative design process by quickly ideating work flows , creating prototypes, testing with users , getting feedback from peer designers and senior stakeholders . From each user testing and review sessions I learned to match comprehension and usability issues from seller side to business needs. Some iterations failed miserably to address business needs while some added extra nuances to the existing mental model.. It all started by understanding what would be the best possible journey for the supplier that help him easily achieve his jobs to be done on this dashboard
Initial brainstorming for creating the journey for the suppliers


Post brainstorming I took to the board to create and test the ideas and gather feedback


Iteration 1 - Users losing intent of why on this dashboard, too much decision making time needed along with a steep learning curve.
Iteration 2 - Users have better intent but losing out to comprehensively understand quality as a focal point. More focused on micro details.

Iteration 3 - Better understanding of problematic products, emphasis on immediate actionable buckets. Suppliers still cannot directly co-relate quality to the problematic buckets. Lack of direct co-relation of quality to returns, reviews and ratings.
Iteration 4- Users have better comprehension of catalog performance, but have low understanding that performance is a lever for quality based on customer returns, bad ratings and reviews that are co-related.

Iteration 5 - Division of jobs to be done with intent of suppliers who wants to understand overview of quality problems followed by catalog details and product details with recommendation. Failed to motivate sellers to create intent and take action based on data. Sellers need better clarity of info and bucketing of quality based on visibility states

Iteration 6 - At overview level anchoring suppliers to new QDS construct and summary of catalogs based on visibility, followed by each catalogs QDS state and product details with recommendations. Suppliers have high intent on understanding what score they have to achieve to maintain good visibility, but failed to understand QDS calculation and relation to time period and orders.
Design Decisions
Lets start with the user flow
After a lot of head scratching it was decided to breakup the whole objective to be reached by sellers into three parts for better comprehension and easy mapping of jobs to be done at each step.

So, here are the Design Considerations
L1 - Overview page of Quality Dashboard
Keep everything easy to comprehend for suppliers based on job to be done by the user.
Establishing a framework for QDS for suppliers to have more focus on performance due to quality
Flagging catalogs based on severity of visibility as suppliers co-relate visibility to order count

L2 - Catalog Details for suppliers
Depending on catalog flagged for performance reasons are displayed for the catalog nor performing well
Showcasing missing out on orders to suppliers as a motivation lever to act and improve quality
Showcase trends of QDS to make users understand improvement or deterioration of order/views on catalog performance for quality

L3 - Product Performance
With established reasons for catalog not performing well, intent created for users to check what customers are saying about their product
Depending on data received on the product we would recommend actions to improve quality of the product

Validation from suppliers
Post design modifications I reached out to the seller cohorts and conducted five usability tests to validate if the suppliers were still facing any comprehension issues and are they able to resolve the problems they were facing previously
Bad Quality Score easily understandable
“Ye Bad Quality Score kam hai toh accha hai mere liye nahi toh mera visibility kam ho jayega"
Upfront recommendations and actions
“Mereko ye recommendation sahi laga , meesho ye bolega toh pe change karunga , pehle ye nahi tha”
Supplier understand quality and metrics related to it
“Ye table pe jo muje dikh raha hai ye sahi hein decision lene ko kaunsa product pe kaam karna hein"
Challenges faced
The major three challenge that I faced as a designer on this project are
Creating a framework for Quality is first of its kind on Meesho hence educating value of Quality to supplier is a vast challenge that needs to be monitored and tweaked from time to time.
Bad Quality Score has three different internal product frameworks that are running in experimentation phase hence creates conflicts with existing suppliers mental model , I had to understand each internal framework and their data to get a hold how to represent them easily to sellers
Scoping of the project changed after every usability testing as what I hypothesized didn’t match the supplier expectations, hence lot of initial iterations and features needed to be pushed in subsequent variations once suppliers develop a behavior of the same.
